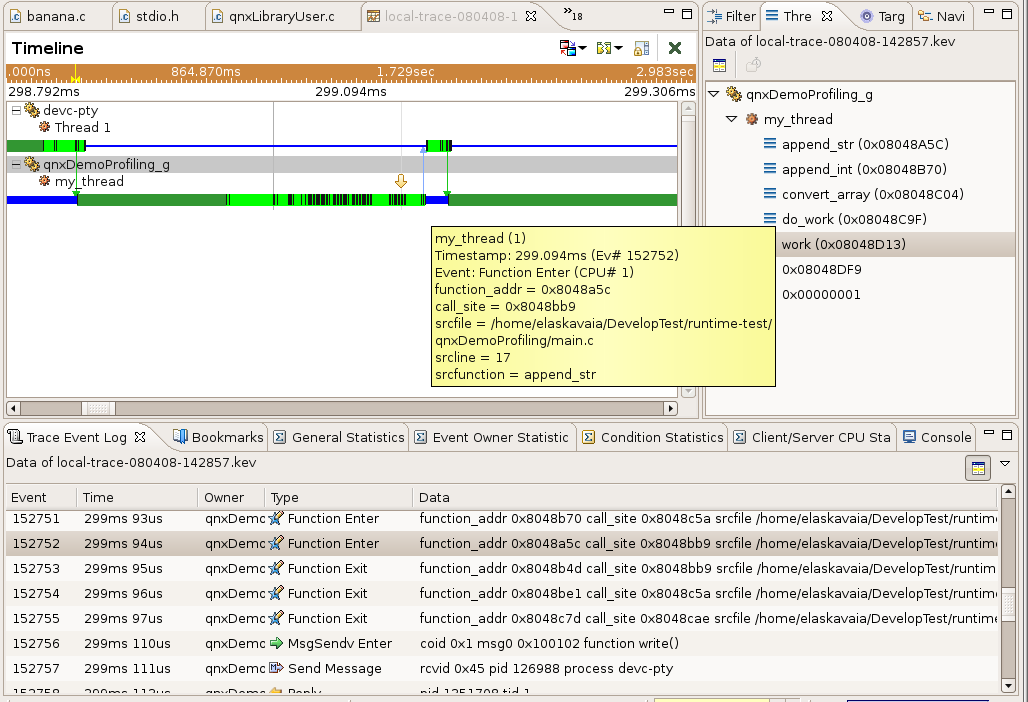
You can see function entry/exit event in addition to other types of events in timeline view
You can see full stack frame of each tread for each timeframe (open Thread Call Stack View)
By default you won't see function names just addresses. You can try to fix it by manually adding binary info, to do it right click on kev file (In Navigator or C/C+= project view), select properties and find Address Translation. You have to close and re-open kev file after that.