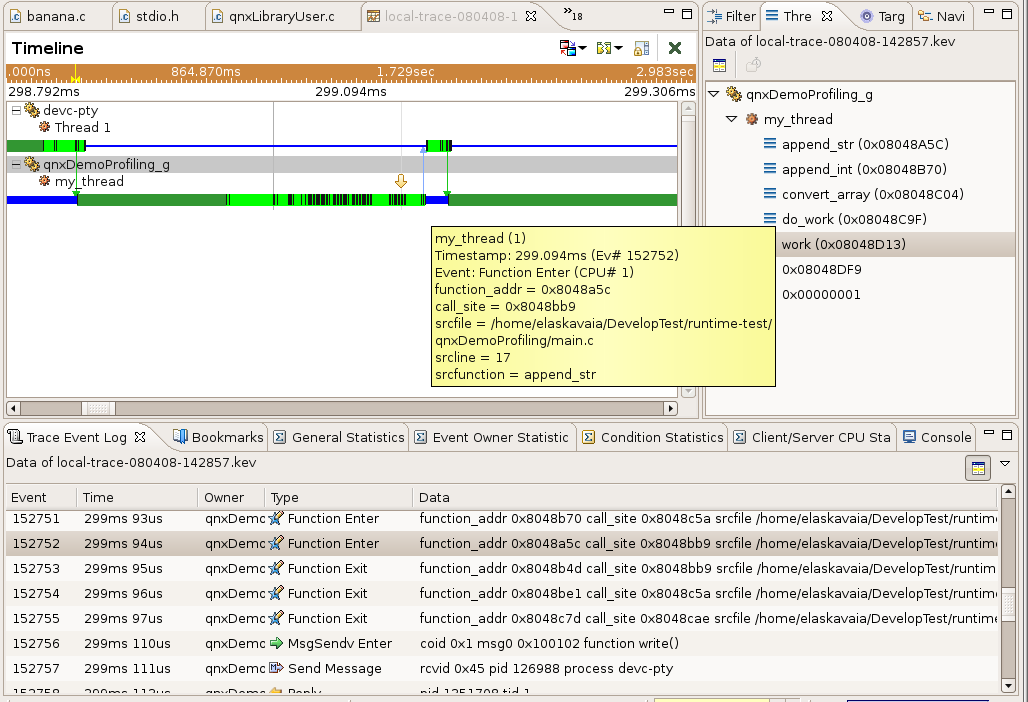
- You can see function entry/exit event in addition to other types of events in timeline view
- You can see full stack frame of each tread for each timeframe (open Thread Call Stack View)
- By default you won't see function names just addresses. You can try to fix it by manually adding binary info, to do it right click on kev file (In Navigator or C/C+= project view), select properties and find Address Translation.
| Attachments: |
 sysProfilerInstr.png
[UsageOfFunctionInstrumentationInSystemProfiler/sysProfilerInstr.png]
sysProfilerInstr.png
[UsageOfFunctionInstrumentationInSystemProfiler/sysProfilerInstr.png]
|
|