Function Instrumentation Mode for System Profiler#
If you missing functions names in System Profiler timeline view you may want to consider adding this information by Instrumenting you binaries with Function instrumentation library and running in kernel events mode.
Build Flags#
- For Qnx projects
- Open Project context menu, select Properties->Qnx C/C++ Project->Options tab
- Select "Build for Profiling (Function Instrumentation)"
- For Manged Project with QNX toolchain
- Open Project context menu, select Properties->C/C++ Build->Settinfs->Tools settings->QCC Compiler->Ouput Control
- Enable "Function Instrumentation Profiling (-finstrument-functions)"
- If you using Makefile
- to compile application/library with instrumentation add option -finstrument-functions
- to link add option -lprofilingS (see Installation section to install this library)
Launch from Command line on target#
- set environment variable QPROF_KERNEL_TRACE=1 (for each process or export it for all processes. It won't affect non instrumented binaries)
- launch one or more processes or target
- In IDE open System Profiler perspective and run Kernel Logging for several seconds
- Open resulting .kev file in System Profiler editor
- Additionally you can import .kev file into Application Profiling from Profiler Session view or using standard File->Import dialog
Launch from IDE#
- If you want to profile process startup, first create a launch configuration for the binary
- In Tools tab select Add Tools... and select QNX Application Profiler AND select Kernel Logging
- In Application Profiler tab
- Select Function Instrumentation (NOT Sampling)
- Select System Wide
- De-select Switch to this tool's perspective on launch if selected
- Click Apply
- Switch to Kernel Logging tab
- Enable "Launch with Kernel Log capturing"
- Select one of existing System Profiler Kernel Log configurations. If you don't have ay select edit and create one.
- Select Switch to this tool's perspective on launch if selected
- Click Apply
- Open Download tab or Launch configuration
- De-select Use unique name (for uploaded binary)
- Click Apply
- Click Run
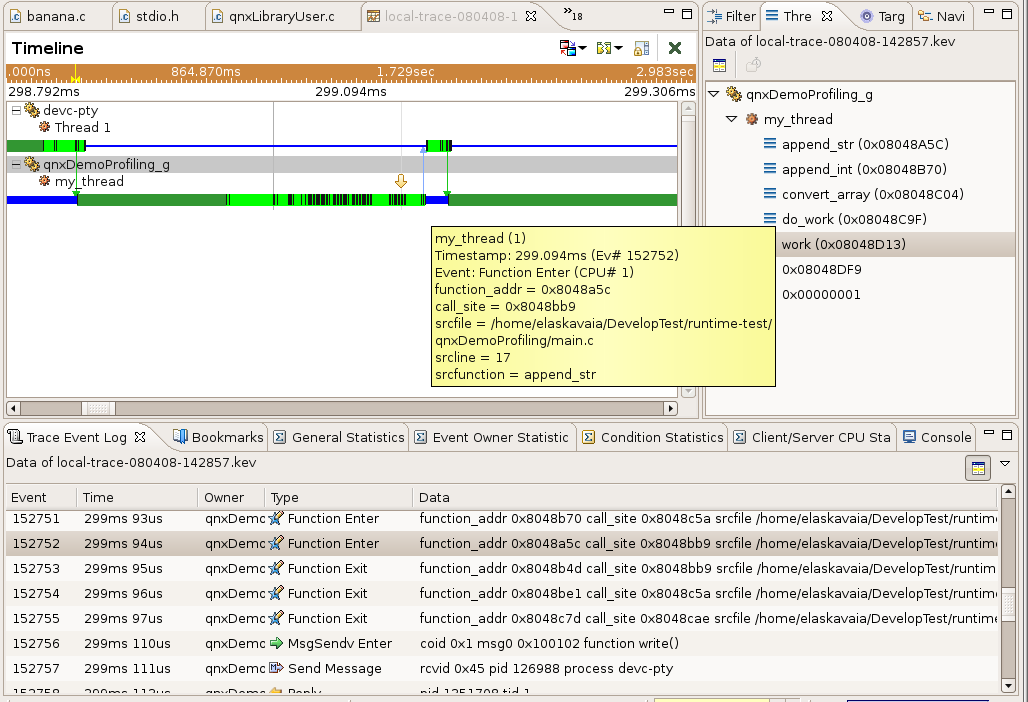
- You can see function entry/exit event in addition to other types of events in timeline view
- You can see full stack frame of each tread for each timeframe (open Thread Call Stack View)
- By default you won't see function names just addresses. You can try to fix it by manually adding binary info, to do it right click on kev file (In Navigator or C/C+= project view), select properties and find Address Translation. You have to close and re-open kev file after that.