Quick way to find memory leaks in C/C++programs#
If your application is leaking memory the best way to find out where it is leaking is to use
Memory Analysis tool.
For first iteration you only need
- you binary located on the target (and all it requires to run)
- TCP/IP connection to the target
- qconn agent running on
- librcheck.so library installed on the the target.
Finding leaks by attaching to application#
This would describe how to create launch configuration to find memory leaks in a binary that was not build in IDE and cannot be launched from IDE.
- In IDE create a C Makefile project (New->Projects...->C Project->Makefile->Empty Project (QNX Toolchain))
- Open Target Navigator and create a New target with IP address of the target you going to be running program
- Copy you binary from target to a host and place in a created project (you can use Target File System Navigator for that)
- Right click on binary and select Profile As...->C/C++ QNX Application Dialog...
- On the Main tab select your target
- Switch to Tools tab and Add Memory Analysis tooling, Enable switch to this tool's perspective (checkbox)
- Click Apply and Close (don't click on Profile button - nothing is running yet
Now go back to target terminal:
Modify you launch script to include extra environment variables (and remove trace file, if exists):
rm /tmp/traces.rmat; LD_PRELOAD=librcheck.so MALLOC_CTHREAD=1 MALLOC_TRACE=1 MALLOC_FILE=/tmp/traces.rmat ./your_app <arg>
and run it, switch back to IDE
- In IDE right click on binary and select Profile As...->C/C++ QNX Application Dialog...
- Configuration is already prepared so just click Profile button
- Pick the process name and click Ok
- IDE should open Memory Analysis perspective
- You should see new session created in Sessions view. Double click on it.
- Let your app run, maybe execute a test that makes it leak memory
- Now switch to Settings tab and press get Leaks button
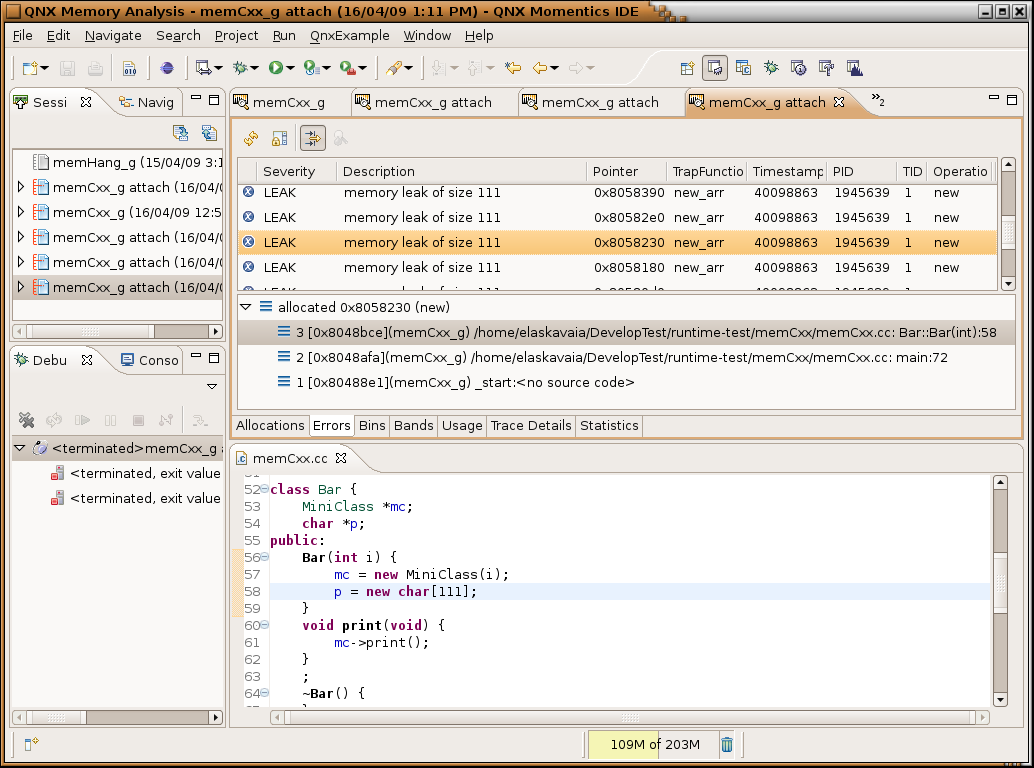
- Switch to Errors tab and you should see Leaks errors there if you have any. Click on error line to see allocation backtrace. This object has no references and has not being freed.
Finding leaks by running from IDE#
- If you don't use IDE to build yoru binary create simple makefile project and drop your binary in there
- Select it, right click and select Run as QNX Application Dialog...
- Select target, Environment, Arguments
- Switch to Tools tab and Add Memory Analysis tooling, Enable switch to this tool's perspective
- When app started, double click on "session" in Sessions view of Memory Analysis perspective, it would open an graphical editor
- Let your app run, maybe execute a test that makes it leak memory
- Now switch to Settings tab and press get Leaks button
- Switch to Errors tab and you should see Leaks errors there if you have any. Click on error line to see allocation backtrace. This object has no references and has not being freed.
What to do if backtrace is not there or has not enough data#
If you see a leak but it does not point to source code or there is no backtrace:
- You need debug version of the binary. You can run non-debug on target but host site has to have debug symbols (must be same build otherwise)
- If you see incomplete trace it can be due to compiler optimization, compile with -O0
- This code can belong to a library, if it is your library you can add it to IDE search path, buy adding path in Shared Library tab of Tools tab (Add tab using Add/Delete Tool... button) of launch configuration. Library has to have debug symbols too for source to show up.
- To capture backtrace memory tracing has to be on (MALLOC_TRACE=1 from command line).
- By default backtrace is depth of 5, if you need more you can change IDE settings in Tools tab or set MALLOC_TRACEBTDEPTH=10 from command line.
If you need more details please consult User Documentation.
