| wiki1249: ApplicationProfiler (Version 16) | |||
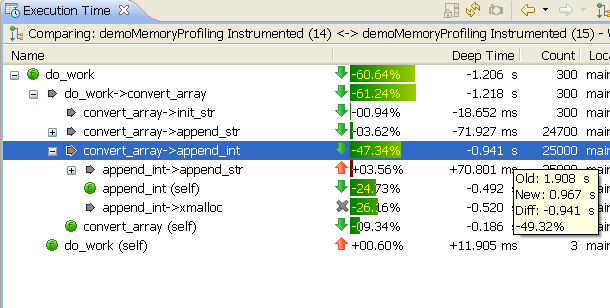
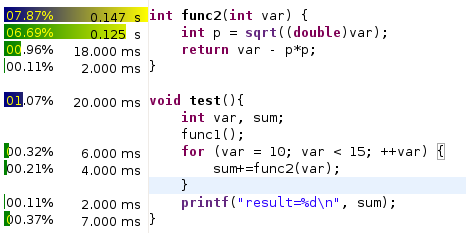
Overview#QNX Momentics Application Profiler is a performance profiler for a single application. It provides statistical profiling for non-intrusive performance measurement, as well as deep and precise function instrumentation performance analysis, visualized with the Execution Time view and the annotated source editor. In addition, instrumented profiling also includes support for call graph information and call counts. Using the Application Profiler, developers can target areas of highly used code for debugging, performance analysis, and optimization of "hot spots".
Features#
Resources #IDE 4.0.1 (bundled with Momentics 6.3.2)#
IDE 4.5 (bundled with SDP 6.4.0)#
IDE 4.6 (bundled with SDP 6.4.1)#
IDE 4.7 (SDP 6.5)#
|
|||