What's new in IDE 4.6?#
This page lists new features and enhancements in IDE 4.6. For a detailed list of bug fixes see Change Log.
System Profiler#
- The address translation binary selection dialog now provides you with a list of selectable binaries, as opposed to having to type one yourself
- Can import selected range from System Profiler into Application profiler (vs whole trace)
- Address Translation properties can now be set for a given kernel logging launch configuration. Any kernel traces created using the launch configuration will have its address translation properties appropriately set. The global address translation preferences are now properly supported
- Library load addresses for address translation now have the option to be auto-discovered from the log file. When kernel logging is used in conjunction with a c/c++ launch and the application profiler tool, address translation for the generated kernel trace will have address translation working without user intervention
- Address Translation's 'pidin mem' import now allows you to only import binaries that are contained within the defined binary search paths
- The System Profiler toolbar now provides a menu to edit the timeline event label properties
- The Partition Summary Element table in the APS Summary pane now displays both thread and process information as a tree (the previous implementation showed a flat list of threads)
- The timeline can now show event label data for address translation related fields. Additionally, the format of the timeline event label is configurable
- The Filters view now supports partition-based filtering
- The General and Event Owners Statistics views can now have their results filtered
- The Partition Summary pane now supports filtering its statistics based on a time range selection
- Thread running events are now recorded in wide mode by default for new kernel trace log launch configurations
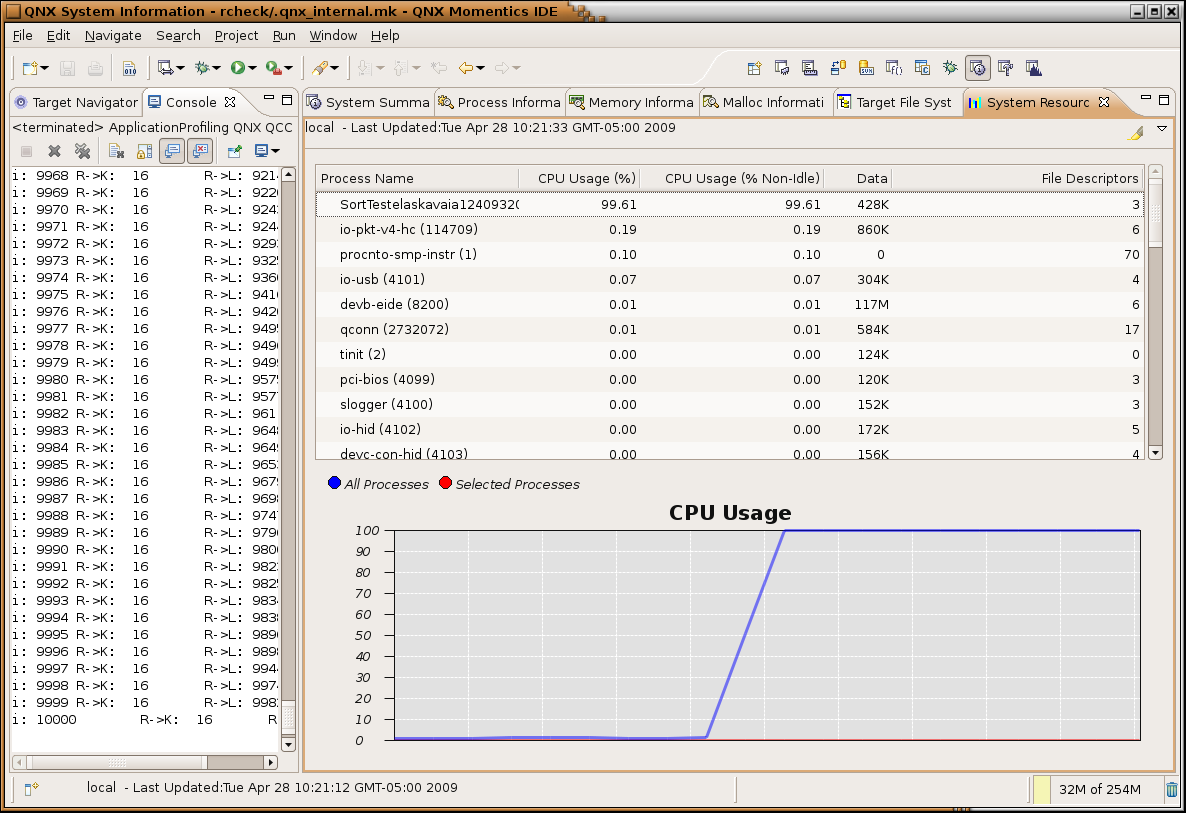
- System Resources view now displays an additional column showing process cpu usage as a percentage against non-idle time
- System Resources view now displays a histogram detailing cpu usage
- The CPU Usage graph of the APS view now displays each partition's budget (as a dotted line) along with its CPU usage
- System Summary view now has a new "Stack" column displaying the process allocated stack size.
Debug & Launch#
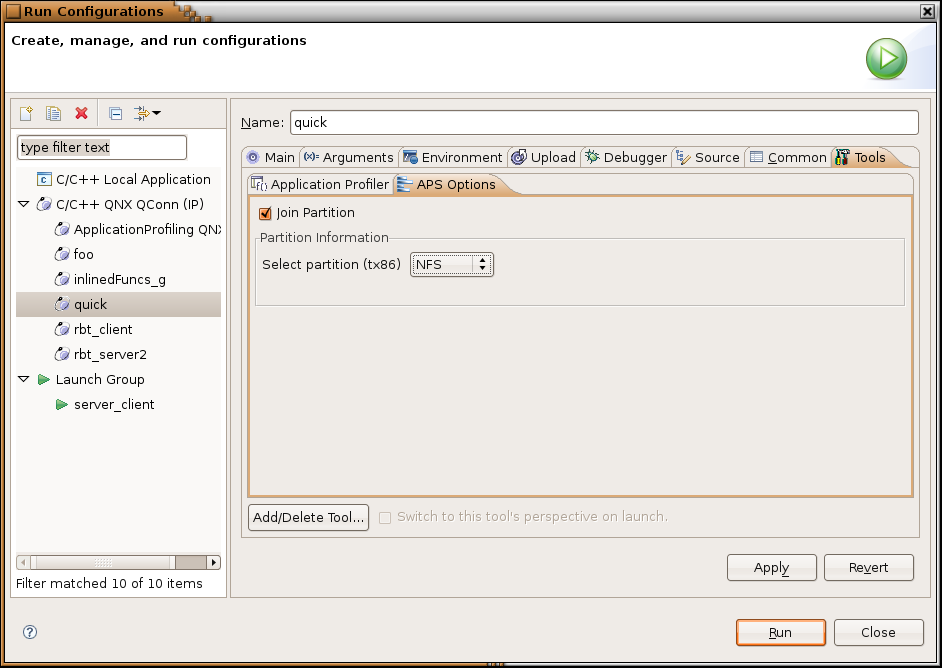
- Allow to specify "partition" (APS) in launch dialog for launched process (in Tools tab)
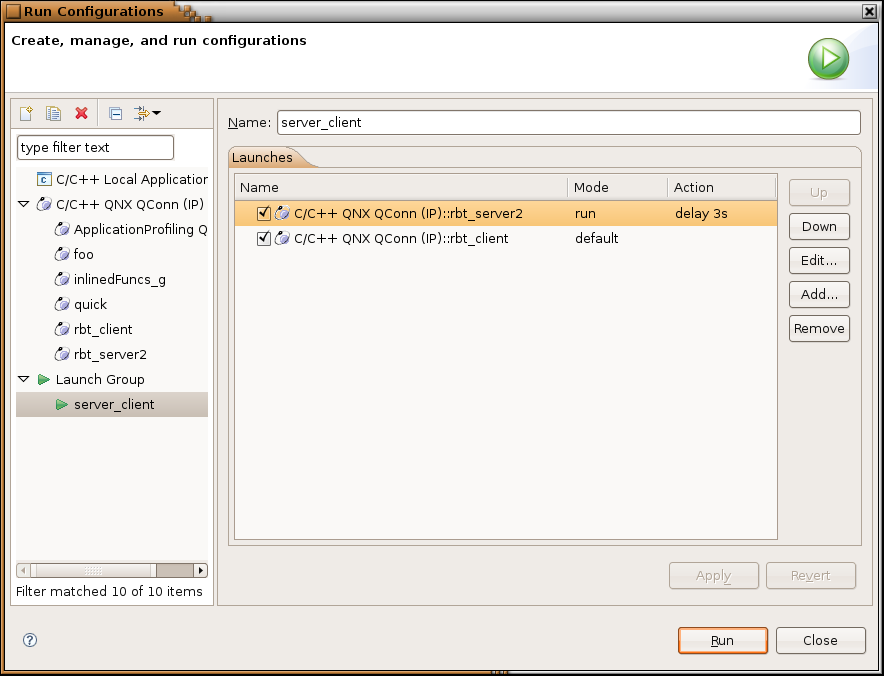
- Support multiple program launch is added (Launch Group). You can now create a launch configuration that launches several processes at once
- Added feature to jump to source code from disassembly (Disassembly View context menu), which together with Goto Address function gives "address to source" capability
C/C++ Development#
- Support for new gcc 4.3.x and gdb 6.8
- Support for ppc spe variant for qnx projects
- Build from command line now supported using mkbuild command which uses IDE project setup and runs IDE in headless mode (without UI) to perfrom a build for selected projects.
Memory Analysis & Error Detection#
- Added new Feature - Mudflap visualization tool. Mudflap is a tool (gcc instrumentation) that allows you to catch runtime errors such as buffer overflows, bad free. etc. To see full error backtrace you need also apply mudflap library patch on targets (mudflap only available starting from 6.4.0)
- Memory analysis filter extended to support pointer values, which now can act as "search" for specific events
- Memory analysis now show allocation backtrace for error that has them
Application Profiling#
- Application profiler now supports Multi-Threaded processes better. Aggregated function time now excludes times that other threads know to be running
- Application profiler now supports multi-cpu targets (requires target patch)
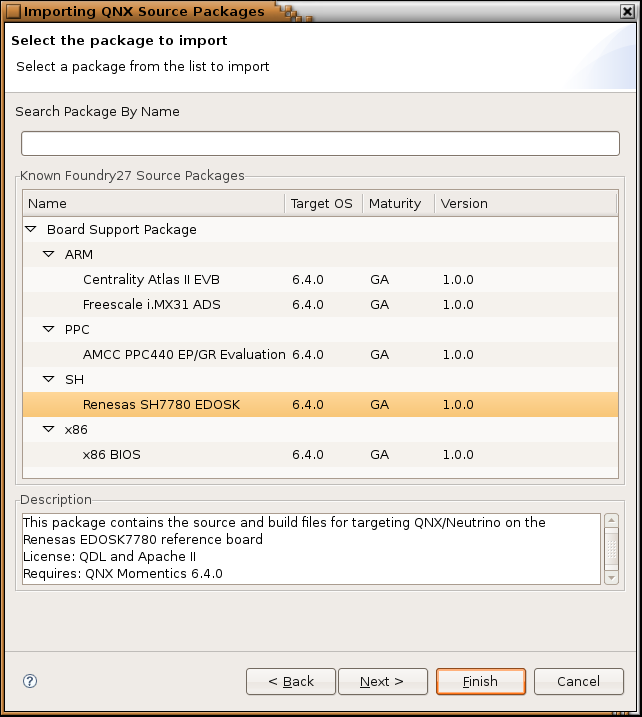
Remote source packages import from Foundry27#
- A remote source discovery mechanism to browse packages available to download from foundry27
- Server-side driven package definition data, with the ability to switch to user defined package definition data via preference settings
- Presents the discovered source packages in a navigable tree made easy with search functionality
- Automatically checks out the sources containing in the selected package without user intervention; Maintains history with the repository
- Creates build-able projects with project configuration and dependencies setup right after the source check-out; Automatically creates required meta-data and meta-project (e.g. BSP project)
Discontinued and Deprecated Items#
- BSP and Source import Wizards are discontinued and replaced with one Import Source Packages and BSPs Wizard. IDE will not longer create a project per driver for BSP packages (all source code would be in one project).
- Discontinued support for 6.3.0 and earlier IDE workspace convertion and import of projects
- Support for libmalloc_g.so library output format for Memory Analysis is deprecated and can be removed in future versions. Use librcheck.so instead.
Hightlights#
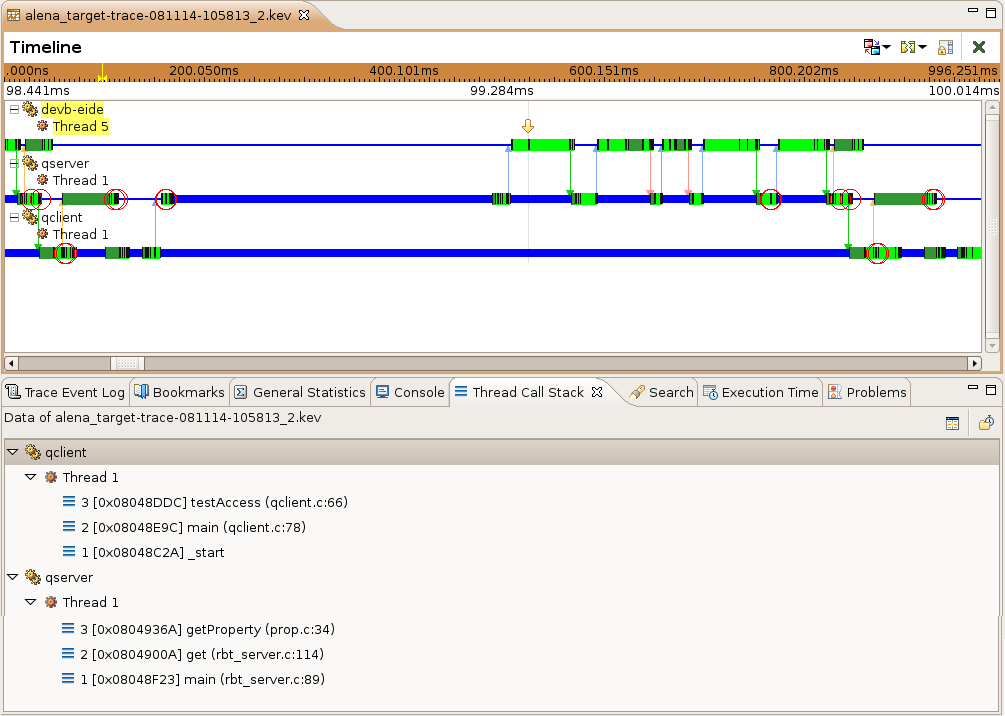
Using Function Instrumentation for two processes in System Profiler to enable Stack Trace view#
Group Launch#
Set Partition for launch#
Qnx BSP Foundry 27 Import#
Live CPU Usage#