Overview#
QNX Momentics Application Profiler is a performance profiler for a single application.
It provides statistical profiling for non-intrusive performance measurement, as well as deep and precise function instrumentation performance analysis,
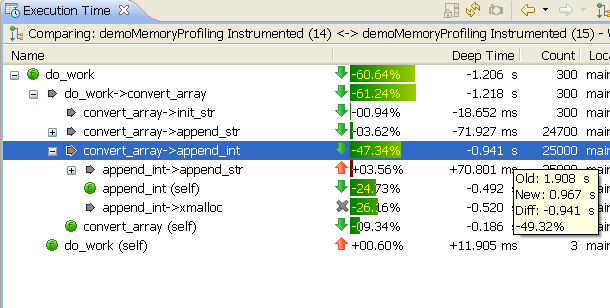
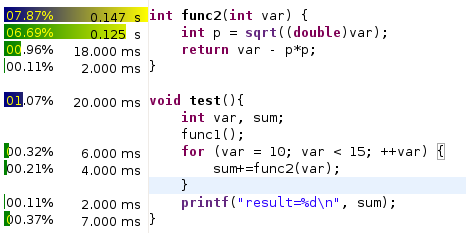
visualized with the Execution Time view and the annotated source editor.
In addition, instrumented profiling also includes support for call graph information and call counts.
Using the Application Profiler, developers can target areas of highly used code for debugging, performance analysis, and optimization of "hot spots".
Features#
- Attaching the profiler to software currently running on the target
- A source code annotated editor to show which lines consume the most CPU
- CPU usage view for multiple processes and targets, as well as for shared libraries
- Profiler enabled launching configuration for end-to-end execution statistics
- Postmortem profiling and analysis
- A Call graph view
- A Sampling Information view with sortable columns
- Supports time marker and shows the time difference since the last mark
Resources #
IDE 4.0.1 (bundled with Momentics 6.3.2)#
IDE 4.5 (bundled with SDP 6.4.0)#
IDE 4.6 (bundled with SDP 6.4.1)#
IDE 4.7 (SDP 6.5)#
- User Documentation Online: Profiling an Application
- Known Issues:
- If you're using Sampling and Call Count Instrumentation, the Application Profiler checks the samples only for processor 0 on a multiprocessor system. (Ref# 77220)
- Workaround: Bind all the its threads so that they run on processor 0 or use other profiling method.
- Attaching to a process using Function Instrumentation in a Single Application mode does not work by default (fixed in 4.7.1)
- Workaround: in the attach launch configuration, application profiler tool check "Use Pipe" option (even file is not a pipe)
- Profiling dll's only without instrumenting the binary does not work
- Workaround: include one call to one function which is instrumented before dlopen (to kick initialization) or
- After dlopen just before first instrumented function is called, add statement _r_debug.r_state = RT_CONSISTENT; (you need to include <sys/link.h> and declare extern struct r_debug _r_debug; somewhere in the file header (you can live it in production code - it actually corrects the bug in linker)