| wiki1720: WhatIsNewInIDE4.5 (Version 6) | ||||||||
What's new in IDE 4.5?#Platform#
C/C++ Development#
System Information#
Memory Analysis#
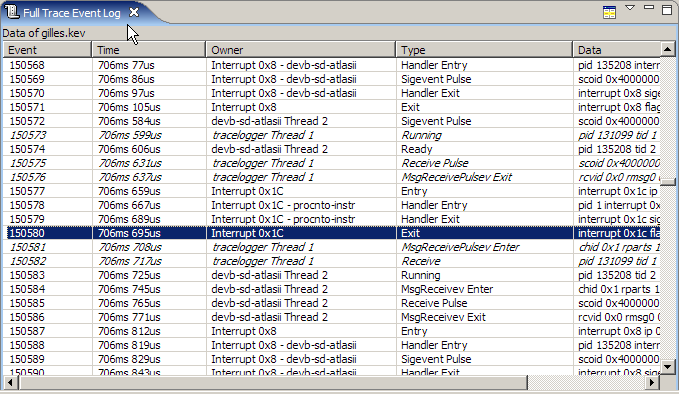
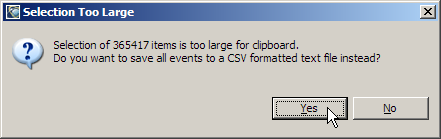
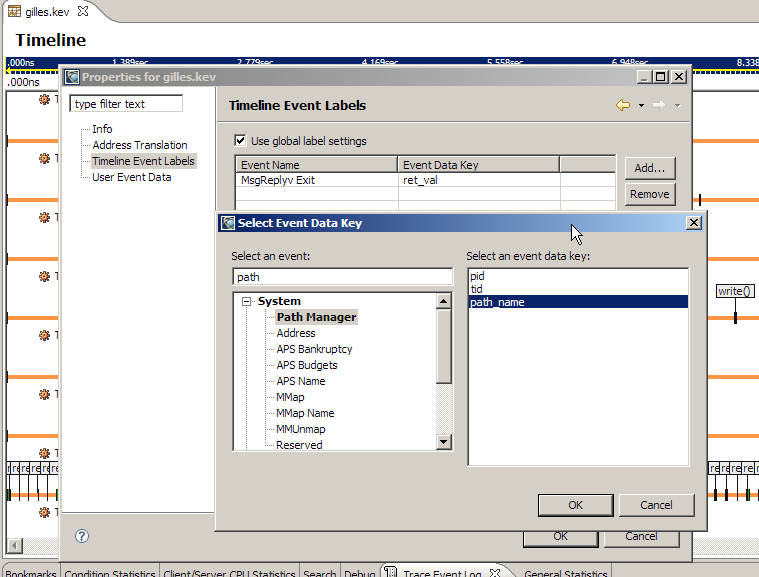
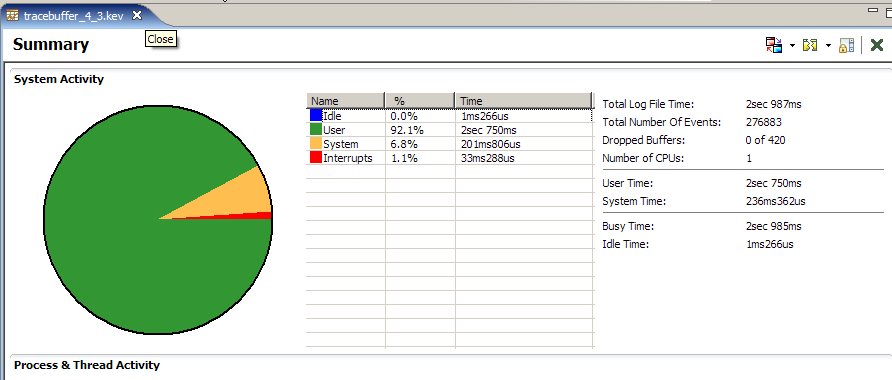
System Profiler#

|
||||||||

Project Home |
Trackers |
Documents |
Wiki |
Discussions |
Project Info |
| wiki1720: WhatIsNewInIDE4.5 (Version 6) | ||||||||
What's new in IDE 4.5?#Platform#
C/C++ Development#
System Information#
Memory Analysis#
System Profiler#
|
||||||||