Project Home
Project Home
Trackers
Trackers
Documents
Documents
Wiki
Wiki
Discussion Forums
Discussions
Project Information
Project Info
BroadcastCommunity.qnx.com will be offline from May 31 6:00pm until June 2 12:00AM for upcoming system upgrades. For more information please go to https://community.qnx.com/sf/discussion/do/listPosts/projects.bazaar/discussion.bazaar.topc28418
wiki1249: ApplicationProfiler (Version 2)

Overview#

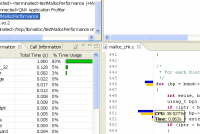
QNX Momentics Application Profiler is a performance profiler for single application. Provides statistical profiling for non-intrusive performance measurement, which can be visualized with function table and source annotations. Also instrumented profiling is supported for call-graph information and call counts.

Using the application profiler, developer can target areas of highly used code for debugging, performance analysis, and optimization of "hot spots".

ApplicationProfilerScreenshot/profiler401_screenshot_small.gifClick to enlarge

Features#

  • Attaching the profiler to software already running on the target
  • Source code annotated editor to show which lines consume the most CPU
  • CPU usage view for multiple processes and targets, as well as for shared libraries
  • Profiler enabled launcher for end-to-end execution statistics
  • Postmortem profiling and analysis
  • Call graph view
  • Sampling Information view with sortable columns
  • Supports time marker and time diff since last mark

Resources#