What's new in IDE 4.5?#
C/C++ Development#
- The new QNX launch and debug shortcut adopt to the new CDT launch and debug framework. It is enhanced to have the ability to detect and associate binaries to remote targets architecture. It is more user friendly since it does most of the works to fill in enough information in the launch configuration, and only requires user attention to the launch configuration dialog while multiple choices are available.
- Added converter from QNX Projects to Managed Make Projects
- A managed build integration for the QNX tool chain
- Several major fixes connected to QNX container projects have been made:
- speed of container project import was increased
- resolved problem of workspace consistency after re-import of container project
- fixed the workspace refresh problem after container project import (sometimes IDE did not refresh project view without restarting or even showed root container only (without components)) .
- fixed the problem when the order of components in container project (and the build order) after import was wrongly changed.
- fixed deadlock during the import operation for container project.
- fixed stripping on non-x86 platforms
- fixed some bugs in container projects (all of them were in UI presentation of build configuration for Container Project, build target specification in particulary.)
- more tuning of container project import process and the IDE responsiveness after import completion. Both issues are very important for big workspaces.
- Added SVN Team Provider and Subversive SVN connectors.
- Fixed out of memory problem when loading huge binaries for navigation in C/C++ View
- Fixed problem with process monitoring when process on target side deliberately closing stdout/stderr
- Added feature to build in parallel in QNX Projects
Debugger#
- Fixed base class members viewing in Variables view
- Fixed shared library loading for gdb 6.7
- Added View Memory action in Variable view
- Updated Debug tab in launch configuration for Qnx Qconn and Qnx Pdebug launches to include debugger selection box and verbose mode option. "Verbose console mode" shows details of interaction with command line debugger in gdb process console. This option can be enabled from launch configuration or by right clicking on the process in debug view.
- GDB breakpoints actions page called "GDB Command Action" is added to the "breakpoint actions" property dialog box. This allows you to enter GDB commands - one command per line. Now you can define GDB command action and attach it to one or more breakpoints. When the breakpoint is hit, the defined GDB command(s) will run and the result will be shown in the GDB console. There is also a new global preference "GDB Command Action" page accessible from "Windows -> Preferences -> C/C++ -> Debug -> Breakpoint Actions". This preference page allows you to define one of more reusable GDB command actions that can be attached to a breakpoint later.
- Fixed (one of them) problem with UI deadlock and debugger UI unresponsiveness during launch and some other cases
- Fixed hardcoded timeouts for suspend operation, default MI command timeout will be used (user configurable)
- Fixed problems with closing dead debug sessions when error happens during the launch
- Fixed problem with debugger hitting disabled breakpoints and not hitting enabled (in some cases)
- New feature "Got To Address..." in disassembly view. Now you can view arbitrary address in disassembly view.
- Source locator - added Absolute Path Mapping entry. For large project which is compiled on the same host as where IDE runs it is preferred way for source location, instead of default (Launch Configuration->Source tab)
- Launch Configuration -> Debug tab: added option to allow set breakpoints using full file name. This is preferred way of setting breakpoints if you have many files with the same basename in the project. Only works when 3.3.5 or higher gcc is used or gdb 6.7 update 4 or higher (available to download from community site)
- Fixed navigation to breakpoint source code when breakpoint is set from gdb console (using address)
- Fixed post-mortem debugging: passing user defined shared libraries path to debugger (there are also related gdb fixes - gdb 6.7 update 5 or higher)
- Fixed problem with showing long long variables
- Added feature to move line number of the existing breakpoint
- JTAG Debug: New debug launch configuration to support "GDB Hardware Debug" through JTAG interface. Built-in supports for Abatron BDI2000 and Macraigor USB2Demon JTAG devices, with other devices support through self-defined hardware specific command sets.
- Added support for gdb catchpoints
- Fixed bugs in source lookup
- Download tab renamed to Upload since it is uploading file to target, fixed several UI issues and bugs with this tab
- Attach to a process with a tool now have general interface, you can attach to a process with debbuger, profiler or memory analysis tool.
- Launch dialog now allows to specify priority of a process
- Debugger now will properly show exit code of the application
Code Coverage#
- Support for gcc 4.2.1
- Fixed coverage calculation for functions defined header files
- Switch to use line coverage for totals instead of basic block coverage
- Stats for functions defiled in header would be excluded from source file coverage
- Added option for selective data collection in order to improve scalability
- Added import of coverage data from remote target
- Fixed some major bugs in Code Coverage, connected to specifics of code generated by contemporary C++ compilers.
- The QNX System Information enhancements with malloc information view that include various charts to help you observe changes in memory usage (allocations and deallocations). Because it is important for you to know when and where memory is being consumed within an application, the Memory Analysis Tooling feature includes several views that use the trace information from the Memory Analysis session to help extract and visually display this information (to determine memory usage; allocation and deallocation metrics). The IDE includes these new views to help you observe changes in memory over time: Outstanding allocations, Allocation deltas, Deallocation deltas, and Outstanding allocation deltas. To access these views, select "Window"-->"Show View"-->"Other" from the menu in the IDE, and then select "QNX System Information"-->"Malloc Information", and click "OK".
- Note: For you to begin to view data on your graphs, you need to set logging for the target, and you need to select an initial process from the Target Navigator view.
- Target Management: New Terminal view with support for Telnet, SSH, various file transfer protocols, and full customization (fonts, colors, sizes)
- Improved drag & drop from and to Target Navigator view
- File system navigator now supports rename operation
Memory Analysis#
- The Memory Analysis Tool lets you import and export trace data from a Memory Analysis session view. With the Memory Analysis Tool, you can:
- Export session information in CSV or XML format. In the IDE, you can export your trace data session information from a Memory Analysis session view. When exporting memory analysis information, the IDE lets you export results in .csv format or in .xml format. Later, you can import the event-specific results into a spreadsheet, or you can choose to import session data back into a Memory Analysis tool to review the results. To export, click "File"-->"Export" from the menu, and then select "QNX"-->"Memory Analysis Data".
- Import memory analysis sessions from trace file or XML format. In the IDE, you can import memory events and memory errors from a Memory Analysis session view. When importing memory analysis session information, the IDE lets you import from libmalloc trace file (generated on the target), or from previously exported session data in XML format. To import, click "File"-->"Import" from the main menu, select "QNX"-->"Memory Analysis Data", and then follow the wizard instructions.nl
- Minor usability improvements - renamed several labels on chart and column names
- Added scroll lock action to prevent view from refreshing
- Fixed zooming/filtering problem on Allocation chart
- Memory analysis tool now support new better library that replaces libmalloc, called librcheck. See instruction on how to install this library here.
- Backtrace support now includes non x86 target and c++ code
- Optimized code of runtime library and events loading code in IDE
- Added support for new/delete operator as memory events
Application Profiler#
You can obtain a detailed description of these features at What is New in Application Profiler.
Trial instruction available here.
- Function enter/exit time instrumentation
- Call Tree/Reverse Call Tree modes
- Context navigation menu
- New Profiler sessions view with sessions persistence
- Profiler sessions comparison
- Session snapshot tool
- Pause/Resume Profiling
- View cloning
- History navigation
- Data Grouping
- Session Import
- Properties view integration
- View customization
- Copy to clipboard
- View Filtering
- Search in Tree View
- Annotated editor improvements
- Export/Import from xml. Export to csv (excel).
- Attaching on the fly: Profile->Attach
System Builder and BSP#
- Fixed permission problem when Starting TFTP server on Linux & Neutrino
- Fixed build file export
- Replaced terminal with DSDP terminal view, which includes com, telnet and ssh connections
- Added feature to import whole directory
System Profiler#
- The icons are back in the Trace Log view. A little bit of visual eye candy that we inadvertantly lost a few releases ago.
- The event owner labels are now consistant throughout the IDE ... and can be configured via the preferences to show the Name, ID or both
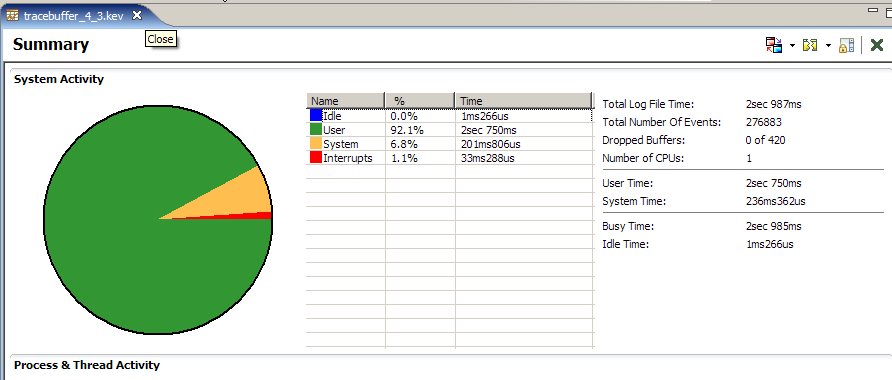
- The summary page now shows you a bit more information about the log, such as how many dropped buffers occured and the total number of events
- The Trace Log view now shows the 'real time' of an event. This is a new column and the start of the log file is based on the DATE property in the log file. Additional precision can be added by setting the start time value in the resource property.
- Address translation for interrupt IP events is now included. The log file must be matched with the binary files in your workspace for the address decoding to occur.
- Kernel log capturing is added to Application Launch configuration as an additional tool. Now you can start logging at the same time you start an application
- The Summary display will now show additional information about the dropped buffers if any are observed in the log file
- The Event Log will now use the DATE information in the log file and provide a 'real time' column to the log display. This can be adjusted or re-baselined in the project property ... also the icons have returned to the Event Log view after a long absence

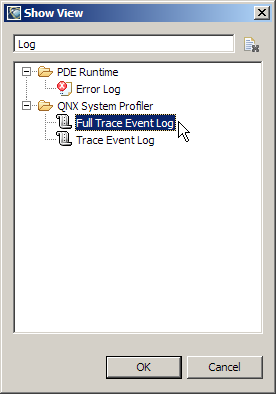
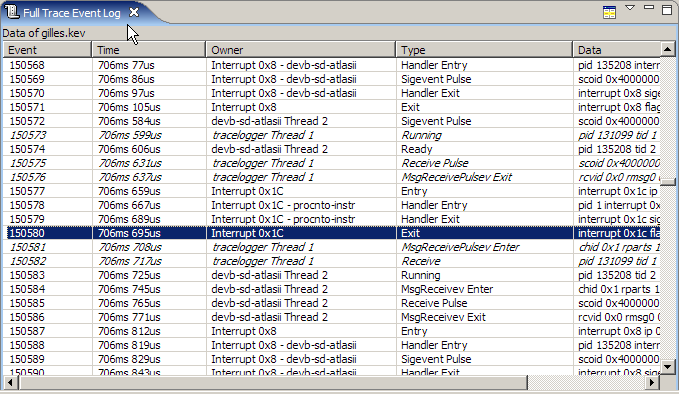
- A new Event Log view has been created that allows users to see the entire log file contents without the "segmented" display of the older Log view. This is accessible via the Window > Show View > Other ... > QNX System Profiler > Ful Trace Eventl Log
| Old Log View | Full Log View |
|---|
 |  |
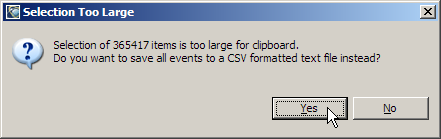
- The export of log file data can be made into a CSV file. This is possible if you try and cut/paste a large selection from the Full Trace Event Log view or as a right click option on the *.kev file System Profiler > Export as CSV data
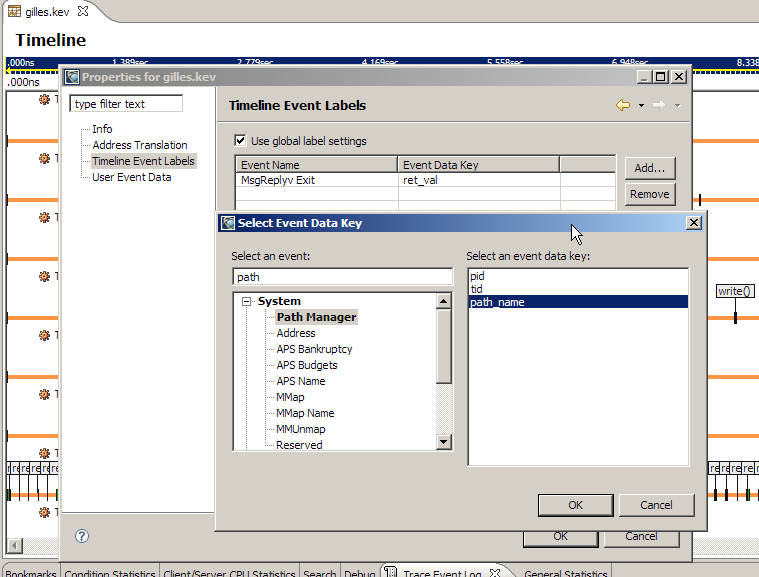
- User event labels are now visible at any zoom level (they are no longer affected by 'pixelization') and are also configurable at both a per-logfile and global basis. This is an initial cut of the interface for selecting the event data. Feedback is welcome
|